- Courses
- GS Full Course 1 Year
- GS Full Course 2 Year
- GS Full Course 3 Year
- GS Full Course Till Selection
- MEP (Mains Enrichment Programme) Data, Facts
- Essay Target – 150+ Marks
- Online Program
- GS Recorded Course
- NCERT- First Ladder
- Polity
- Geography
- Economy
- Ancient, Medieval and Art & Culture AMAC
- Modern India, Post Independence & World History
- Environment
- Governance
- Science & Technology
- International Relations and Internal Security
- Disaster Management
- Ethics
- Current Affairs
- Indian Society and Social Issue
- CSAT
- 5 LAYERED ARJUNA Mentorship
- Public Administration Optional
- ABOUT US
- OUR TOPPERS
- TEST SERIES
- FREE STUDY MATERIAL
- VIDEOS
- CONTACT US
India’s Poverty Story: What Recent Surveys Tell Us
India’s Poverty Story: What Recent Surveys Tell Us
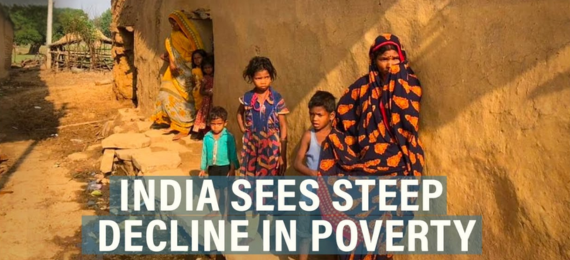
Why in the News?
- The Government of India has released the findings from the two rounds of the Household Consumption Expenditure Surveys (HCES) for 2022-23 and 2023-24.
- The new data helps to remove confusion about how poverty has changed in recent years.
- Earlier, there was confusion because the government did not release the 2017–18 Consumption Expenditure Survey, saying that there were data quality issues.
Historical Background of Poverty in India:
|
Period/Year |
Significance |
|
1950s–1990s – Planning Era |
Poverty alleviation became central to Five-Year Plans. |
|
1993 - Tendulkar Committee |
Shifted poverty estimation from a calorie-based approach to a consumption-based methodology that is focused on both minimum calorie intake and expenditure levels. |
|
2011-12 - Rangarajan Committee |
Recommended higher poverty lines. (From Rs. 32 for urban and Rs. 26 for rural to Rs. 47 for urban and Rs. 32 for rural areas). |
|
2011–2023 – Data Vaccum Period |
The last official poverty data was from the 2011-12 NSSO survey. The 2017-18 survey was withheld due to quality issues, causing a data gap. |
|
2021 (onwards) - NITI Aayog’s Multidimensional Poverty Index (MPI) |
Broadened poverty metrics beyond income to include education, health, and living standards. |
|
2022–2024 - New Household Consumption Expenditure Surveys (HCES) |
Conducted after over a decade; filled the data gap since 2011–12; enabled fresh poverty estimates. |
Poverty:
Poverty Line:
Multidimensional Poverty Index (MPI):
|
Types of Poverty:
-
Based on Income:
- Absolute Poverty: Falling below a minimum income needed for basic survival.
- Relative Poverty: Having much less income than most people in your society, leading to social and economic inequality.
-
Based on Expenditure:
- Measures poverty based on household spending on essential goods and services.
-
Capability Approach (Amartya Sen’s Perspective)
- Poverty is defined by lack of access to opportunities and inability to achieve basic life outcomes.
- Example: Even if income is sufficient, lack of education, healthcare, or social mobility can keep individuals in poverty.
-
Based on Poverty Line:
- Below Poverty Line:
- Extreme Poverty: It covers people who struggle for basic survival needs like food, shelter, etc.
- Normal/ Moderate Poverty: People who earn slightly more than extreme poverty levels but still lack access to essential services like quality education or healthcare.
- Above Poverty Line:
- Vulnerable Class: Just above the poverty line but still at risk of falling back due to unexpected crises like job loss, health emergencies, etc.
- Lower Middle Class: Can afford basic needs and some comforts but may have financial limitations on non-essential spending.
- Middle & Upper Classes: Those with stable incomes who can comfortably afford quality education, healthcare, and leisure activities. Upper classes hold substantial wealth, investments, and financial security.
- Below Poverty Line:
Key Data Insights:
-
World Bank:
- Extreme Poverty fell from 27.1% in 2011-12 to 5.3% in 2022-23.
- This decline happened even after the World Bank raised the extreme poverty line from $2.15 per day to $3 per day.
- People living in extreme poverty in India fell from 344.47 million to 75.24 million over this period.
- As per the poverty line for lower-middle income countries (revised from $3.65 a day to $4.2 a day), the poverty ratio in India fell from 57.7% in 2011-12 to 23.9 % in 2022-23.
- Inequality in India also fell between 2011 and 2022. It was based on measures like the Gini and Theil indices.
-
NITI Aayog:
- Multidimensional Poverty in India has experienced a steep decline, falling from 55.34% in 2005-06 to 24.85% in 2015-16 to 14.96% in 2019-21.
- These estimates drew data from the National Family Health Surveys.
Extreme Poverty:
National Family Health Survey:
Gini and Theil Indices:
|
Methods of Poverty Measurement in India:
- Consumption-Based Measurement – In this, the consumption expenditure (that is, the amount spent on goods and services by an individual or a household) is seen to measure poverty. For example, the Household Consumption Expenditure Survey.
- Income-Based Measurement – In this, the income level of a person is considered to measure the poverty level. For Example, the World Bank’s extreme poverty line is set at $3 per day.
- Multidimensional Poverty Index (MPI): This method includes factors like education, healthcare, and living standards to assess poverty beyond just income.
Key Surveys Related to Poverty in India:
-
Household Consumption Expenditure Survey (HCES):
- It is a national survey that collects data on how much households spend on goods and services (like food, clothes, housing, etc.).
- It helps estimate poverty levels and inequality in the country.
- It is usually done every 5 years to understand household spending.
- The 2017-18 survey was not published due to problems with data accuracy.
- After a long gap, the survey was carried out in two rounds, 2022-23 and 2023-24.
- The two rounds helped get a clearer picture of spending after the pandemic.
-
Periodic Labour Force Survey:
- It is conducted annually.
- It provides data on labour force participation and job status in both rural and urban areas.
- It helps to track the status of employment and unemployment in India.
-
National Family Health Survey:
- Provides insights into health, nutrition, and living conditions, which are crucial for poverty assessment and policy decisions.
Organisations Associated with Poverty Measurement:
- NITI Aayog: It analyses poverty trends beyond just income levels using MPI.
- National Statistical Office (NSO) (under the Ministry of Statistics and Programme Implementation) conducts major surveys like HCES, helping in poverty measurement.
- World Bank defines international poverty lines and conducts global poverty assessments.
- United Nations Development Programme (UNDP) tracks poverty through the Multidimensional Poverty Index (MPI) globally.
Challenges and Way Forward:
|
Challenges |
Way Forward |
|
Lack of updated data |
Ensure regular release of official surveys like the Periodic Labour Force Survey, etc. |
|
Fragmented methodologies |
Create a Unified National Poverty Index by considering various dimensions of poverty, like income, education, health, etc. |
|
Ineffective scheme delivery |
Improve last-mile delivery via digitisation and social audits |
|
Hidden poverty in urban areas |
Expand focus on urban poverty mapping and gig workers |
|
Income inequality |
Promote inclusive growth via labour-intensive sectors and skill development. |
|
Ensure IAS Mains Question Q. In the context of poverty estimation in India, critically examine how data transparency and methodological choices shape the policy response to poverty and inequality. (150 words) |
|
Ensure IAS Prelims Question Q. Consider the following statements regarding poverty estimation in India:
Which of the above statements is/are correct?
Answer: c Explanation: Statement 1 is correct: The World Bank revised the poverty threshold upward to $3 a day from $2.15 a day, which is a stricter benchmark. Despite this, the estimates show a sharp decline in extreme poverty in India — from 27.1% in 2011–12 to 5.3% in 2022–23. Statement 2 is correct: NITI Aayog’s Multidimensional Poverty Index (MPI) does not rely on income or consumption data. Instead, it uses a composite approach that includes indicators across health (nutrition, child mortality), education (years of schooling, school attendance), and standard of living (like access to electricity, drinking water, housing, etc.). |
India’s Poverty Story: What Recent Surveys Tell Us
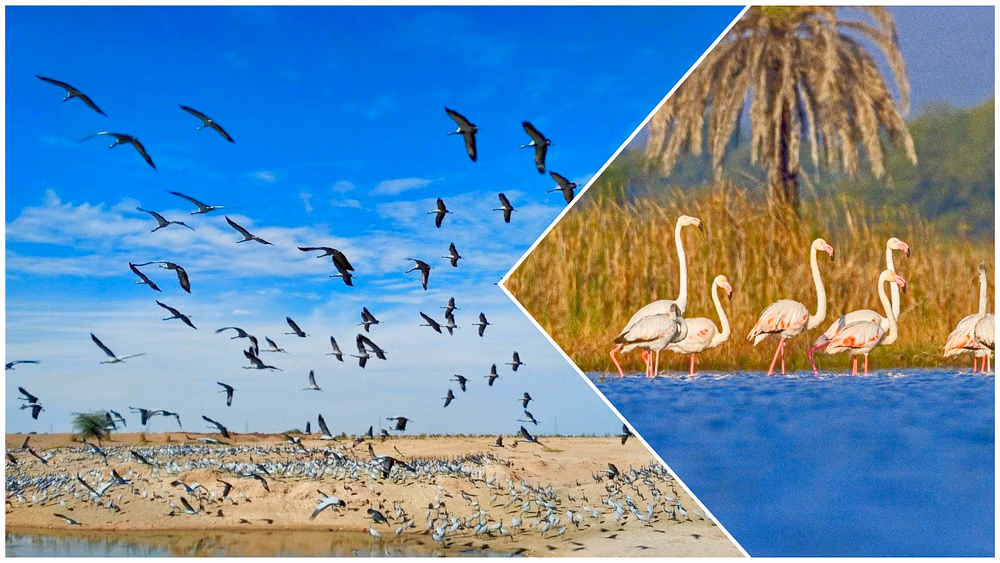
2 New Ramsar sites: Menar (Udaipur) And Khichan (Phalodi)
EnviStats India 2025
Karol Bagh Metro Pillar No. 112, Above Domino's, 22B, First Floor, New Delhi - 110060
Very Important Instruction For Any Issue, Student Must Produce His/Her Fee Receipt. Without Fee Receipt, It Will Not Be Possible To Track Your Details. If You Have Been Given Any Special Consideration, You Must Keep That In Writing And Produce In Case Of Conflict.
Copyright © 2024-2026 ENSURE IAS. All rights reserved.