- Courses
- GS Full Course 1 Year
- GS Full Course 2 Year
- GS Full Course 3 Year
- GS Full Course Till Selection
- MEP (Mains Enrichment Programme) Data, Facts
- Essay Target – 150+ Marks
- Online Program
- GS Recorded Course
- NCERT- First Ladder
- Polity
- Geography
- Economy
- Ancient, Medieval and Art & Culture AMAC
- Modern India, Post Independence & World History
- Environment
- Governance
- Science & Technology
- International Relations and Internal Security
- Disaster Management
- Ethics
- Current Affairs
- Indian Society and Social Issue
- CSAT
- 5 LAYERED ARJUNA Mentorship
- Public Administration Optional
- ABOUT US
- OUR TOPPERS
- TEST SERIES
- FREE STUDY MATERIAL
- VIDEOS
- CONTACT US
EnviStats India 2025
EnviStats India 2025
Why in the News?
- The Ministry of Statistics and Programme Implementation (MoSPI), Government of India, released the 8th issue of “EnviStats India 2025: Environment Statistics” on 5th June 2025.
- The report gives important data about India’s environment and how it has changed over the years.
What are the Key Highlights?
- Power Generation
- Electricity production from thermal power increased from 7,92,053 GWh (2013-14) to 13,26,549 GWh (2023-24).
- Electricity from renewable energy (like solar, wind) rose from 65,520 GWh to 2,25,835 GWh in the same period.
- Fish Production
- Inland fish production (like in rivers and ponds) grew from 61.36 lakh tonnes to 139.07 lakh tonnes (2013-14 to 2023-24).
- Marine fish production (from seas) increased from 34.43 lakh tonnes to 44.95 lakh tonnes.
- Climate Data
- Annual mean temperature increased from 25.05°C (2001) to 25.74°C (2024).
- Minimum temperature rose from 19.32°C to 20.24°C.
- Maximum temperature rose from 30.78°C to 31.25°C.
- Rainfall shows high yearly changes in its pattern but no clear long-term increase or decrease has been observed.
- Biodiversity
- India has 1,04,561 faunal species out of the world total of 16,73,627 species.
- India also has 20,613 marine species, 9,436 freshwater species, 5,023 species in mangroves, 3,383 estuarine species, 22,404 soil species.
- Government Spending on Environment (2021–22):
- Rs. 2,433.24 crore spent on the Environment Sustainability sector.
- Spending on Conservation of Natural Resources is rising.
- The Agro-Forestry sector had the lowest spending.
- New Additions in the Report:
- New data on electricity, transport, and sanitation access for the population.
- A list of Ramsar Sites (important wetlands) has been added.
- The report follows the international FDES 2013 structure.
Framework for the Development of Environment Statistics (FDES)
|
What are the Significances?
- Helps in Better Policy Making: The report gives important data to the government. This helps in making smart and strong plans for protecting nature and fighting climate change.
- Tracks India’s Environmental Progress: It shows how India is improving in areas like clean energy, fish production, and biodiversity.
- Supports Sustainable Development Goals (SDGs): The data helps in checking India’s progress towards global goals for a healthy environment.
- Promotes Use of Technology and New Data Sources: It encourages the use of modern tools like satellites and AI to collect and use data better.
- Guides Future Action: It helps in identifying problems like rising temperatures, pollution, and resource overuse, so that steps can be taken early.
What are the Challenges and Way Forward?
|
Challenges |
Way Forward |
|
Promote use of clean energy and reduce carbon emissions. |
|
Improve water storage and rainwater harvesting. |
|
Increase support for agro-forestry and natural resource conservation. |
|
Use advanced technology like satellite and AI for better data. |
|
Strengthen sustainable fishing and protect marine ecosystems. |
|
Protect wildlife habitats and control pollution in forests and water bodies. |
Conclusion
The release of “EnviStats India 2025: Environment Statistics” marks an important step towards better environmental understanding and decision-making in India. It gives us a clear picture of how our natural resources, climate, biodiversity, and government efforts are changing over time. By following international standards like the FDES 2013, the report ensures that India's environmental statistics are reliable, structured, and comparable globally.
|
Ensure IAS Mains Question:
Q. The EnviStats India 2025 report is a major step towards data-driven environmental governance in India. Discuss the significance of environmental statistics in policy-making. also, highlight the challenges in environment data collection and suggest measures to overcome them. (250 words) |
|
Ensure IAS Prelim MCQ:
Q. With reference to the "EnviStats India 2025" report released by the Ministry of Statistics and Programme Implementation (MoSPI), consider the following statements:
Which of the above statements is/are correct? A) 1 and 2 only Answer: B Explanation:
|
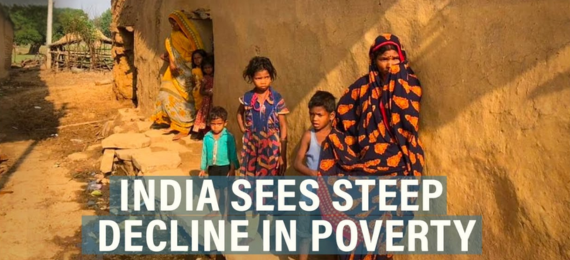
India’s Poverty Story: What Recent Surveys Tell Us
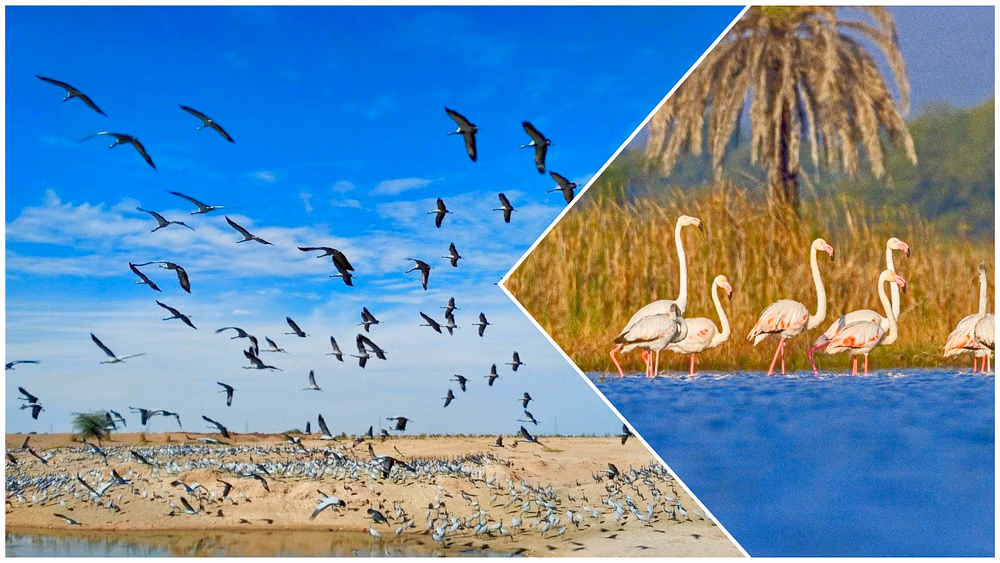
2 New Ramsar sites: Menar (Udaipur) And Khichan (Phalodi)
EnviStats India 2025
Karol Bagh Metro Pillar No. 112, Above Domino's, 22B, First Floor, New Delhi - 110060
Very Important Instruction For Any Issue, Student Must Produce His/Her Fee Receipt. Without Fee Receipt, It Will Not Be Possible To Track Your Details. If You Have Been Given Any Special Consideration, You Must Keep That In Writing And Produce In Case Of Conflict.
Copyright © 2024-2026 ENSURE IAS. All rights reserved.