
Context
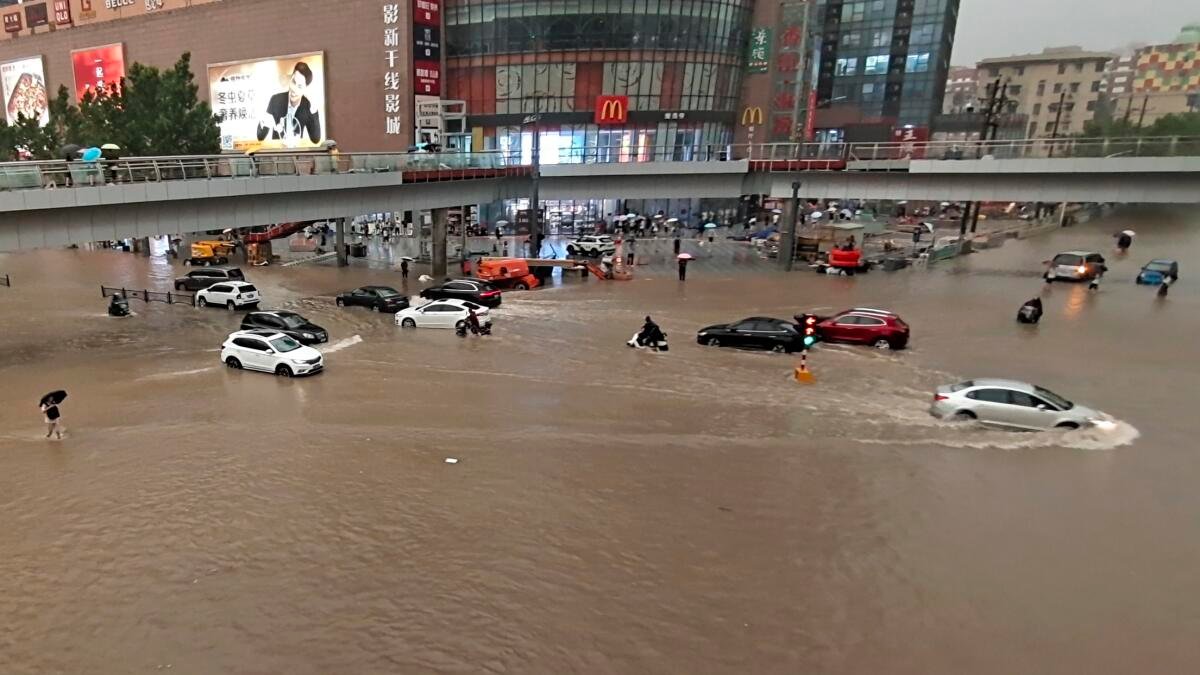
- Recent devastating floods in Sri Lanka, Indonesia, Thailand, and the Philippines have exposed a major weakness in how countries judge the “modernity” and “liveability” of cities.
- Urban liveability rankings often celebrate metros like Mumbai, Delhi, Kolkata, Chennai, but these metrics fail to measure a city’s real ability to protect people during cyclones, cloudbursts and landslides.
What liveability indices currently measure?
- UN-Habitat City Prosperity Index measures: Productivity, Quality of life, Infrastructure, Equity, Environmental sustainability and Urban governance.
- Global Liveability Index Checks: Stability, Healthcare, Education, Infrastructure and Culture & environment.
- City Resilience Index Assesses: Health & well-being, Economy & society, Infrastructure and Leadership & strategy.
Problem: These indices do not assess whether a city can withstand 21st-century extreme weather, despite climate risks rising every year.
Why do recent Asian floods expose weaknesses in these rankings?
- Major events
- Sri Lanka: Cyclone Ditwah → floods & landslides; 400+ deaths
- Indonesia: Cyclonic storms → villages destroyed
- Thailand: South Thailand & Hat Yai received “heaviest rainfall in centuries”; floods metres deep
- Philippines: Typhoon Kalmaegi → massive flooding in Cebu & Visayas
- Secondary cities absorb the worst impacts
- Cities like Hat Yai, Cebu, and small towns around Colombo suffer the most—but they are not covered in major indices. Thus, high-risk urban areas are invisible in global assessments.
Core shortcomings of liveability indices
- Grey infrastructure built for older climate patterns
- Many cities used:
- Drains designed for weaker rainfall
- Slope settlements without stability assessment
- Many cities used:
- Outdated stormwater systems
- They collapse under:
- 300+ mm rain in a day
- Rapid landslides
- Two-day entrapments due to poor evacuation
Yet, indices reward cities simply for having infrastructure, not for its climate adequacy.
- Indices ignore micro-level vulnerabilities
- Indices fail to differentiate:
- A brick house on stable land
vs - A brick house cut into a dangerous hillside
- A brick house on stable land
- Indices fail to differentiate:
Both count as “durable housing” even though only one is safe.
- Indices distort investment priorities
- Cities with good scores attract more investment—even if:
- Their drainage is weak
- Their slopes are unstable
- Cities with good scores attract more investment—even if:
- Their growth increases exposure to floods
- Governments then prioritise:
- Airports
- Metro lines
- Riverfront beautification
…but ignore:
- Desilting canals
- Maintaining culverts
- Enforcing zoning laws
- Relocating residents from dangerous areas
These neglected tasks are essential for climate resilience.
- Indices widen socio-economic inequality
- City-wide averages hide vulnerabilities:
- Wealthy people recover faster (insurance, mobility, stronger housing)
- Poor peri-urban settlers face the first and worst impacts
- Thus, liveability rankings:
- Reward high-value coastal/hill development
- Ignore risk transfer to low-income communities
- Global aid often bypasses the most vulnerable cities
- International climate finance requires:
- Technical reports
- Data
- International climate finance requires:
- City-wide averages hide vulnerabilities:
- Planning documents
- Only large metros can produce
- Smaller, high-risk towns → receive little adaptation funding, even though they face greater climate danger.
Key implications for India
- Indian metros differ significantly in disaster resilience (e.g., Mumbai vs Chennai vs Delhi).
- Rankings hide vulnerabilities in fast-growing peri-urban belts.
- Urban planning must shift from “liveability” to “climate survivability.”
- Infrastructure must be designed for future climate extremes, not past averages.
Challenges and Way Forward
| Challenges | Way Forward |
| Liveability indices ignore climate resilience | Create India-specific Climate Resilience Index for cities |
| Infrastructure designed for outdated rainfall patterns | Update national building codes, stormwater norms |
| Investment prioritises glamour projects | Mandate spending on drainage, slope stability, river rejuvenation |
| Exclusion of secondary cities in global assessments | Build local data systems in tier-2/tier-3 cities |
| Risk shifted to poorest settlements | Implement risk-sensitive land-use zoning and safe relocation |
| Weak early-warning and evacuation capacity | Expand IMD–NDMA integrated urban warning systems |
Conclusion
Urban liveability must be redefined for the climate era.
A “modern” city is not one with metro lines and glossy waterfronts—but one where a 300 mm cloudburst does not collapse infrastructure or kill people.
Without measuring climate resilience, global rankings mislead policymakers and deepen inequalities.
Cities must shift from a model of growth-led modernity to a model of climate-safe development.
| EnsureIAS Mains Question
Q. Recent floods in Asian cities highlight that global liveability and prosperity indices fail to capture real climate resilience. Briefly discuss key shortcomings in these indices and suggest practical measures to integrate climate risk and equity into urban planning. (250 Words) |
| EnsureIAS Prelims Question
Q. With reference to urban ‘liveability’ and ‘resilience’ in the context of climate change, consider the following statements: 1. Global liveability indices generally focus more on infrastructure and services than on the capacity of cities to handle extreme rainfall and floods. 2. Secondary cities and peri-urban settlements that face high climate risk are often not covered in major global city rankings. 3. Current prosperity and liveability indices usually distinguish clearly between safe and unsafe locations within a city, such as stable hillsides versus unstable slopes. 4. Focusing only on city-wide averages in indices can hide the disproportionate climate risks borne by poorer communities. Which of the statements given above are correct? (a) 1 and 2 only Answer: (b) 1, 2 and 4 only Explanation: Statement 1: Indices like the Global Liveability Index and City Prosperity Index measure things such as infrastructure, education, healthcare, public transport, culture, etc. They do not systematically assess whether drainage systems can handle cloudbursts, whether hillsides are stable, or whether stormwater capacity matches 21st-century extremes. Statement 2: The article notes that cities like Hat Yai (Thailand) or Cebu (Philippines), and many hill towns and peri-urban belts, do not appear in many global liveability/prosperity indices. Yet, these are exactly the places where floods, landslides and climate shocks hit hardest. This shows a coverage bias towards capital cities and big global hubs. Statement 3: The text explicitly points out that indices may record “durable housing” or infrastructure without distinguishing between: ○ A safe brick house on stable land, and ○ A similar house cut into an unstable slope or risky hillside. So they do not clearly distinguish such micro-level risk variations. Statement 4: City-wide averages can show higher prosperity, better access, and rising land values in flood-prone or risky areas. But in reality, when extreme rain or storms hit, poor peri-urban or informal settlers suffer the most, while wealthier residents have more protection and recovery capacity. Thus, index averages conceal inequity in risk distribution. |