What is AQI (Air Quality Index)?
- Air Quality Index (AQI) is a numerical scale used to show how polluted the air is and how it affects human health.
- It measures 8 pollutants: PM2.5, PM10, NO₂, SO₂, CO, Ozone, Ammonia and Lead.
- AQI categories range from Good → Satisfactory → Moderate → Poor → Very Poor → Severe.
- Higher AQI means greater health risk, especially for children, elderly, and people with respiratory problems.
- The World Health Organization (WHO) sets global air quality limits to protect human health. These limits show how much pollution is considered safe, even for long-term exposure. WHO PM2.5 guideline (24-hour average): at or below 15 µg/m³ → Safe limit
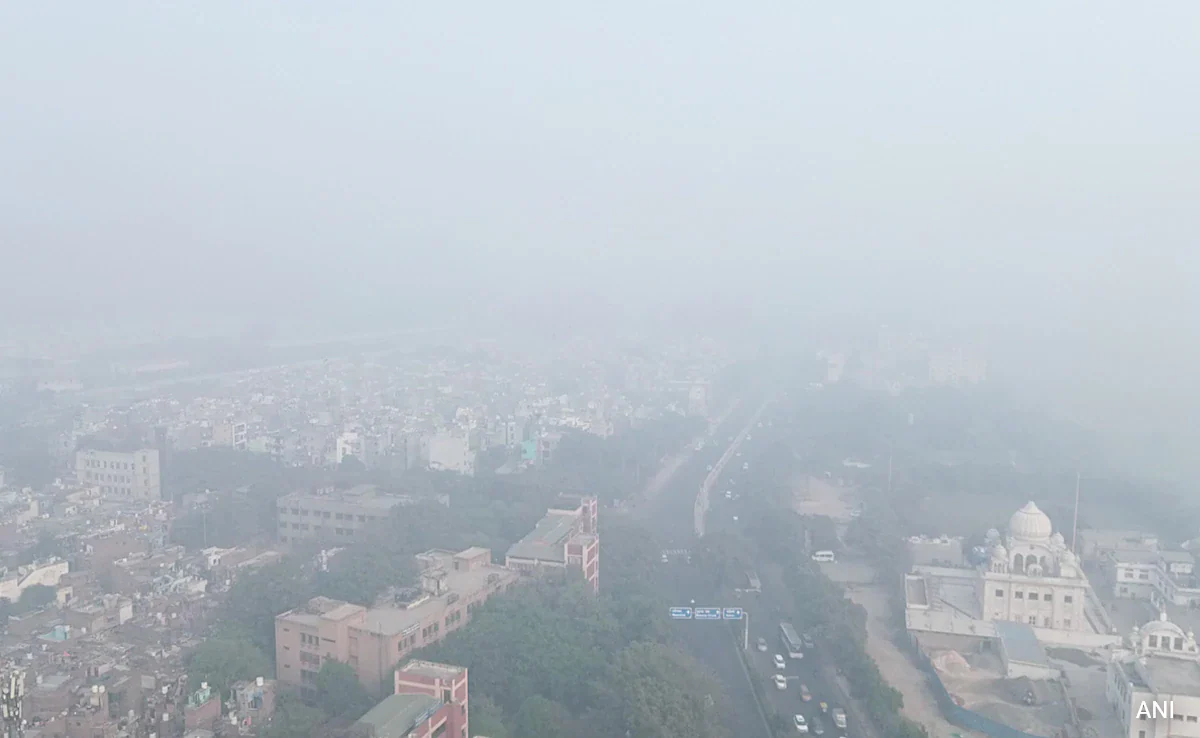
- Delhi often records PM2.5 above 200–400 µg/m³ in winter, which is many times higher than the WHO limit. This shows that even “moderate” AQI levels in India can still be unsafe by WHO standards.
Why Does Delhi’s AQI Become Very High (“very poor” to “severe”) in Winter?
Unfavourable Atmospheric Conditions:
- Temperature inversion: In winter, a layer of warm air forms above cooler air near the surface, acting like a lid and preventing pollutants from rising and dispersing vertically.
- Low temperature and high humidity: Also, cold and humid air increases the formation of secondary pollutants (like nitrates and sulfates) and helps fine particles absorb moisture and grow, worsening haze and PM2.5 levels.
- Low wind speed: This is accompanied by very low wind speed, so the pollutants are not blown away horizontally and keep accumulating instead of being diluted.
- Shallow boundary layer: In winter, the air near the ground does not rise much, so the layer of air where pollution can spread becomes very thin/shallow, and pollutants get trapped (compressed) close to the surface, thus raising pollution concentration.
- Lack of rain and dry weather: Also, winter is mostly dry with very little rainfall, so there is no “washout” effect to remove pollutants from the air.
- This reduces both horizontal and vertical dispersion of pollutants, leading to smog.
Regional and Geographical Factors:
- Stubble burning in Punjab/Haryana: In October-November, farmers burn paddy stubble, and winter winds blow from north west towards Delhi. These winds carry this smoke into Delhi, adding a large pulse of PM2.5 and other pollutants.
- Geographical “bowl” effect: Delhi lies in the Indo‑Gangetic Plain, surrounded by mountains to the north and hills to the west, which restricts the free flow of air and traps the pollutants.
Transport & Energy-Related Emissions
- Increased vehicular emissions: Cold weather reduces engine efficiency, increases fuel consumption, and leads to higher emissions of PM, NO₂, and CO, especially during traffic peaks.
- More industrial and power plant emissions: Many industries and thermal power plants continue to operate, and their emissions (SO₂, NO₂, PM) add to the pollution load.
- Regional transport of pollution: Old diesel vehicles, generators, etc., from surrounding regions add to Delhi’s pollution through long-range movement of pollutants.
Dust and Open Burning
- Construction and road dust: Dust from construction sites and unpaved roads contributes significantly to PM10 and PM2.5; in winter, this dust stays suspended longer due to low wind and high humidity.
- Firecrackers: Diwali and other winter festivals involve bursting firecrackers, which cause a sharp, short‑term spike in PM2.5, SO₂, and noise, pushing AQI into the “severe” category.
Household & Lifestyle Factors (Seasonal Behaviour)
- Burning of waste and biomass: People burn garbage, plastic, and biomass (wood, cow dung) for heating and cooking in winter, releasing large amounts of PM2.5, CO, and toxic gases.
- Domestic heating and cooking: Use of wood, kerosene, and LPG for heating and cooking increases in winter, adding to indoor and outdoor pollution.
How AQI (Air Quality Index) is calculated in India using a combination of 8 pollutants?
- India follows the National Air Quality Index (NAQI) system to measure air pollution.
- The AQI is calculated by the Central Pollution Control Board (CPCB) using data from continuous air quality monitoring stations across the country.
- Instead of a single pollutant, AQI is based on a combination of multiple pollutants present in the air.
- Pollutants Considered under India’s AQI (NAQI): The AQI considers the following 8 major air pollutants:
1. PM2.5 – Fine particulate matter (most harmful) – It is so small that it can penetrate deep into the lungs and even enter the bloodstream, causing serious respiratory, cardiovascular, and neurological problems.
2. PM10 – Coarse dust particles
3. Nitrogen Dioxide (NO₂)
4. Sulphur Dioxide (SO₂)
5. Carbon Monoxide (CO)
6. Ozone (O₃)
7. Ammonia (NH₃)
8. Lead (Pb)
How the Final AQI Value is Decided?
- For a valid AQI calculation, data for at least 3 pollutants must be available.
- PM2.5 or PM10 must be one of them, as particulate matter is critical for health assessment.
- For each pollutant, a sub-index is calculated based on its measured concentration.
- The highest sub-index value among all 8 pollutants becomes the overall AQI for that location and day, and the pollutant that gives this highest value is called the “index pollutant” (e.g., PM2.5 in Delhi).
- This ensures that the most harmful pollutant dominates the AQI reading.
6 AQI Categories Based on 6 PM2.5 Level Break Points, 6 NAQI values and 6 colour codes
| S. No | Level of PM2.5 (µg/m³, 24-hr avg) | NAQI Value | Category
NAQI |
Colour
NAQI |
Health Implications (NAQI |
| 1 | 0 – 30 | 0 – 50 | Good | Green | Minimal impact on health |
| 2 | 31 – 60 | 51 – 100 | Satisfactory | Light Green | Minor breathing discomfort to sensitive people |
| 3 | 61 – 90 | 101 – 200 | Moderate | Yellow | Breathing discomfort to people with lung disease (like asthma) and discomfort to people with heart disease, children and older adults. |
| 4 | 91 – 120 | 201 – 300 | Poor | Orange | Breathing discomfort to most people on prolonged exposure and discomfort to people with heart disease. |
| 5 | 121 – 250 | 301 – 400 | Very Poor | Red | Respiratory illness on prolonged exposure. More harm to people with lung or heart disease. |
| 6 | 250 + | 401 – 500 | Severe | Dark Red / Maroon | Serious health impacts; affects even healthy people. The health impacts may be experienced even during light physical activity. |
How is AQI calculated differently by different countries using different methods and different combinations of pollutants?
Similarities between US EPA AQI and India’s NAQI
- Same AQI scale (0–500): Both systems use a 0 to 500 numerical scale to show how polluted the air is. Higher value = worse air quality and higher health risk.
- Similar colour bands and categories: Both use colour coding like Green, Yellow, Orange, Red, Purple/Maroon. Categories broadly indicate Good → Moderate → Poor/Unhealthy → Very Poor/Severe air quality.
Differences between US EPA AQI and India’s NAQI
- US EPA AQI (by US Environmental Protection Agency) uses 6 pollutants: PM2.5, PM10, O₃ (8‑hr & 1‑hr), CO (8‑hr), SO₂ (1‑hr), and NO₂ (1‑hr) while India’s NAQI includes the same 6, plus ammonia (NH₃) and lead (Pb). This makes India’s AQI more suitable for Indian conditions, where farm burning, waste burning, and industrial emissions are common.
- At low to moderate pollution levels, the US EPA is stricter and flags health risks earlier for Pm 2.5. Example: A PM2.5 level that may still look “acceptable” in India can already show concern in the US. At very high pollution levels, India’s AQI rises faster and labels pollution as more severe. Example: AQI 500 in India ≈ AQI ~420 in the US for PM2.5. India treats extreme pollution as more dangerous.
- Ozone (O₃) standards: India’s NAQI is much stricter for ozone than the US. Ozone pollution appears worse on India’s AQI scale. For example, an O₃ level that gives AQI 150 (Unhealthy for sensitive groups) in the US may give AQI 300 (Very Poor) in India.
- Purpose and local adaptation: The US EPA AQI is designed for relatively cleaner air and is more sensitive to small changes, so even modest pollution is flagged early. India’s NAQI is adapted to “Asian dust” conditions (high PM from dust, farm fires, vehicles) and is calibrated so that very high pollution is clearly marked as “Severe” or “Hazardous”.
6 AQI Categories Based on PM2.5 Levels for USA
| S. No. | Level of PM2.5 (µg/m³, 24-hr avg) | AQI Value | Category | Colour |
| 1 | 0.0 – 9.0 | 0 – 50 | Good | Green |
| 2 | 9.1 – 35.4 | 51 – 100 | Moderate | Yellow |
| 3 | 35.5 – 55.4 | 101 – 150 | Unhealthy for Sensitive Groups | Orange |
| 4 | 55.5 – 125.4 | 151 – 200 | Unhealthy | Red |
| 5 | 125.5 – 225.4 | 201 – 300 | Very Unhealthy | Purple |
| 6 | 225.5 – 325.4 | 301 – 500 | Hazardous | Maroon |
Why is AQI Calculated and Shown?
- Air pollution data is complex and involves mainly 8 pollutants, which is difficult for the common public to understand.
- AQI converts this data into a single, simple number and category.
- It helps people understand current air quality at a glance and enables them to take precautions like wearing masks or avoiding outdoor activities.
- It also assists authorities in triggering control measures such as the Graded Response Action Plan (GRAP).
What effects/impacts does high AQI have?
- Health Impacts
- Causes breathing problems, asthma attacks, eye and throat irritation.
- Long-term exposure increases risk of lung diseases, heart disease, stroke, and cancer.
- Children, elderly, pregnant women, and people with respiratory or cardiac illnesses are most affected.
- Weakens immunity and reduces overall life expectancy.
- Impact on Daily Life, Economy & Work
- People avoid outdoor activities, exercise, and unnecessary travel due to polluted air.
- More people fall sick, leading to higher medical expenses and absence from work or school.
- Work, businesses, and tourism slow down as fewer people are able to move and work normally.
- Transport & Visibility Impacts
- Dense smog reduces visibility, leading to road accidents, flight delays, and train disruptions.
- Slower traffic movement and increased congestion.
- Environmental Impacts
- Damage to crops and vegetation due to toxic pollutants.
- Reduced photosynthesis and lower agricultural productivity.
- Acidic pollutants harm soil and water bodies.
- Governance & Emergency Measures
- Forces authorities to impose restrictions such as vehicle curbs, construction bans, school closures, and emergency actions under pollution-control plans.
What Can Individuals Do During High AQI?
When AQI reaches poor, very poor, or severe, individuals can reduce health risks by following simple precautions:
- Wear N95 masks outdoors to reduce inhalation of fine particles (PM2.5).
- Avoid outdoor exercise, especially in early morning and late evening when pollution is highest.
- Use air purifiers indoors, particularly for children, elderly, and people with asthma or heart disease.
- Keep doors and windows closed during peak pollution hours.
- Reduce personal emissions by using public transport, car-pooling, or work-from-home.
- Do not burn garbage, leaves, or biomass, as it directly adds to local pollution.
These steps help reduce personal exposure, even though they cannot solve the problem alone.
What Steps Is the Government Taking? (Policy & Long-Term Measures)
- Graded Response Action Plan (GRAP): GRAP is an emergency plan activated when AQI worsens in Delhi-NCR.
| Stages | Description |
| GRAP-I (When AQI is ‘poor’) | Actions taken: Water sprinkling on roads to reduce dust, Mechanical sweeping of roads, Strict checking of vehicle pollution certificates and Ban on open burning of garbage and leaves, etc.
Goal: Control dust and small pollution sources early. |
| GRAP-II (When AQI is ‘very poor’) | Actions taken: Restrictions on diesel generator sets, Increased parking fees to discourage private vehicle use, Strong action against polluting industries and More public transport services, etc.
Goal: Reduce emissions from vehicles and generators. |
| GRAP-III (When AQI is ‘severe’) | Actions taken: Complete ban on construction and demolition activities, Closure of stone crushers, brick kilns, and hot-mix plants, Schools may be shifted to online mode and Non-essential trucks banned from entering Delhi, etc
Goal: Cut down major pollution sources immediately. |
| GRAP-IV (When AQI is ‘extremely severe’) | Actions taken: Odd-Even scheme for private vehicles, Work-from-home for offices (where possible), Complete ban on non-essential construction and Strict vehicle restrictions, etc.
Goal: Protect public health during extreme pollution. |
- Action Against Stubble Burning
- Farmers are provided subsidies for machines like Happy Seeder, Super-SMS, and mulchers to manage crop residue.
- Financial incentives and compensation are given to discourage burning.
- States monitor fields using satellite tracking and ground enforcement.
- Crop residue is promoted for bio-energy, composting, and industrial use.
- This addresses one of the largest seasonal sources of PM2.5 in north India.
- Control of Vehicular Pollution
- Enforcement of BS-VI emission norms, which significantly reduce PM and NO₂ emissions.
- Phasing out old diesel and petrol vehicles, especially in Delhi-NCR.
- Promotion of electric vehicles (EVs) through subsidies and charging infrastructure.
- Expansion of metro, buses, and public transport to reduce private vehicle use.
- Cleaner Industrial and Energy Practices
- Industries required to shift to cleaner fuels like PNG instead of coal or furnace oil.
- Installation of pollution control devices in thermal power plants.
- Closure or relocation of highly polluting industrial units near cities.
- Promotion of Clean Cooking and Heating
- Schemes like Ujjwala Yojana promote LPG use to reduce biomass burning.
- Awareness campaigns discourage use of wood, coal, and waste for heating.
- Regional Air-shed Management
- Pollution is managed at the regional level, not city-wise.
- Coordination among Delhi, Punjab, Haryana, UP, and Rajasthan to tackle shared pollution sources.